Measure a blog audience with OpenTelemetry
I like to know which articles are the most widely read and how many visitors pass through the blog each day. This blog has gone through several stages to measure these things. At first, it was Google Analytics. But I’m not really comfortable with giving Google all this information. So I went through Matomo, hosted at the CHATON: Libréon .
TL;DR
Want to track traffic to your static blog without Matomo or Google Analytics ?
Here’s how to use OpenTelemetry, Prometheus and Grafana with a little homemade JS script (Otela) to monitor visits with class, efficiency… and respect for your data.
The problem
The problem with Matomo is that it’s registered as a tracker for most Ad-Blockers, regardless of whether you’re doing audience measurement or pure tracking. And on a technical blog, almost all visitors have an Ad-Blocker. Which makes the measurement fairly false. What’s more, I find that Matomo is a bit slow and the data isn’t the freshest - you have to wait until the next day to get the data.
I worked quite a bit on the Grafana stack and OpenTelemetry for the Baywatch project . And I wanted to reuse this stack to replace Matomo. Since I already had a server with everything I needed installed.
The other problem is that on a static site, hosted on Github Pages or another “Pages”, you don’t have access to the web server logs to collect them. It is therefore necessary to use a JS client.
Otela, the js client
The first step is to have a javascript client that will ping the Open Telemetry collector with the info from the visited page. OpenTelemetry has a SDK that can be used to transmit metrics and traces. Unfortunately, logs are still under development.
Sending ping as a metric is not possible, as it’s not adapted to the way OpenTelemetry and Prometheus work, since it only pushes 1s, and the counter returns to zero on each visit.
Sending spans, on the other hand, works well. For each visit, Otela sends a span to the OpenTelemetry collector with the attributes of the page visited (title, url, etc.).
The Otela project is available on github: https://github.com/Marthym/otela
It is derived from one of the OpenTelemetry SDK sample projects. It is open source. A build WebPack optimizes the size of the otela.js file to be included in pages.
What exactly is a span ?
A span, in the OpenTelemetry universe, represents a single operation or event in a trace. It’s the basic unit of observation. Each time a user visits a page on your site with Otela, a span is created to record this “action”: the URL visited, the page title, the browser used, the origin (referrer), etc. This span is then sent to the OpenTelemetry collector. It contains customizable attributes that you can extract and transform to generate metrics that can be used in Prometheus. In short, the span acts as an enriched, structured log, perfect for tracking user interactions on a static site.
Installation
To install Otela, simply add this javascript code to the end of your HTML pages:
<!-- Otela -->
<script>
    var _ota=window._ota=window._ota||{};_ota.t="your.opentelemetry.server";
    (function(){
        var t=document,e=t.createElement("script"),a=t.getElementsByTagName("script")[0];
        e.async=!0;e.src="https://github.com/Marthym/otela/releases/download/1.0.0/otela.js";a.parentNode.insertBefore(e,a)
    })();
</script>
<!-- End Otela Code -->
It is necessary to configure the OpenTelemetry collector to receive the spans and the js source. Here, the source is directly the github artifact; it’s more efficient to embed the otela.js file in your site’s sources to avoid blocking the script by the url.
OpenTelemetry Configuration
To collect the spans sent by Otela, you need to configure the OpenTelemetry collector so that it collects the spans, transforms them into metrics and stores them in Prometheus.
The receiver
receivers:
  otlp/otela:
    protocols:
      http:
        endpoint: ':4318'
        cors:
          allowed_origins:
            - http://*
            - https://*
          max_age: 7200
On the receiver, the important thing is to configure the CORS correctly, depending on your needs, restrict them as much as possible. Here, the CORS are very open, but if you only have one site to monitor, tighten the configuration.
The processors
processors:
  batch:
  filter/otela:
    spans:
      include:
        match_type: strict
        services:
          - "blog.ght1pc9kc.fr"
          - "swr.ght1pc9kc.fr"

  attributes/otela:
    actions:
      - key: referrer
        pattern: ^https?:\/\/(?P<dummy>[^@\n]+@)?(?P<referrer>[^:\/\n?]+)
        action: extract
      - key: dummy
        action: delete
      - key: referrer
        value: direct
        action: insert
For the processors, we start by filtering the entries, so as to keep only the spans that come from the sites we’re monitoring. Then we process the span attributes according to what we want to keep. In our case, we don’t keep the whole referrer, just the domain.
The connector
All that remains is to transform the spans into metrics. In other words, count the spans to count the visits. OpenTelemetry offers connectors. This is a configuration that connects the span pipeline directly to the metrics pipeline.
connectors:
  spanmetrics/otela:
    namespace: otela
    histogram:
      explicit:
        buckets: [6ms, 10ms, 100ms, 250ms, 500ms]
    dimensions:
      - name: navigator
      - name: os
      - name: platform
      - name: referrer
      - name: title

service:
  pipelines:
    traces:
      receivers: [otlp/otela]
      processors: [filter/otela, attributes/otela]
      exporters: [spanmetrics/otela]
    metrics:
      receivers: [spanmetrics/otela]
      processors: [batch]
      exporters: [prometheus]
We therefore connect the connector to the traces output AND to the metrics input. In addition to counting spans, the “span to metrics” connector allows you to calculate percentiles.
Retrieve IPs
In order to distinguish visitors, it is necessary to retrieve the visitor’s IP address. But this isn’t possible using javascript, not without making additional requests and not without revealing data to an external site.
This is where the NginX front-end comes in, which you must have placed in front of the OpenTelemetry collector. It knows the IP of the visitor transmitting the spans. And it can transfer the information to OpenTelemetry via the request headers.
    location / {
        try_files $uri $uri/ @proxy;
    }

    location @proxy {
        proxy_set_header Host $host;
        proxy_set_header X-Real-IP $remote_addr;
        proxy_set_header X-Forwarded-Host $host;
        proxy_set_header X-Forwarded-Port 443;
        proxy_set_header X-Forwarded-For $proxy_add_x_forwarded_for;
        proxy_set_header X-Forwarded-Proto https;
        proxy_set_header X-GeoIP-Latitude  $geoip_latitude;
        proxy_set_header X-GeoIP-Longitude $geoip_longitude;
        proxy_pass $upstream;
    }
And with NginX’s GeoIP module, it’s possible to recover the geographic coordinates of visitors, enabling them to be placed on a map in Grafana.
On the OpenTelemetry side, the configuration is as follows:
receivers:
  otlp/otela:
    protocols:
      http:
        endpoint: ':4318'
        include_metadata: true
        cors:
          allowed_origins:
            - http://*
            - https://*
          max_age: 7200

connectors:
  spanmetrics/otela:
    namespace: otela
    histogram:
      explicit:
        buckets: [6ms, 10ms, 100ms, 250ms, 500ms]
    dimensions:
      - name: ip
      - name: navigator
      - name: os
      - name: platform
      - name: referrer
      - name: title
      - name: latitude
      - name: longitude

  attributes/otela:
    actions:
      - key: referrer
        pattern: ^https?:\/\/(?P<dummy>[^@\n]+@)?(?P<referrer>[^:\/\n?]+)
        action: extract
      - key: dummy
        action: delete
      - key: referrer
        value: direct
        action: insert
      - key: ip
        from_context: X-Real-IP
        action: upsert
      - key: latitude
        from_context: X-GeoIP-Latitude
        action: upsert
      - key: longitude
        from_context: X-GeoIP-Longitude
        action: upsert
The important parameter is include_metadata: true, which allows you to retrieve NginX headers from OpenTelemetry processors. All that remains is to retrieve the values and add them to the span attributes before sending it to Prometheus.
🔥Just a heads-up🔥, collecting IP addresses and geolocation data significantly increases the cardinality of your metric attributes, which in turn impacts the storage required by Prometheus. So it’s important to use this configuration with caution, and make sure you set proper storage limits:
   --storage.tsdb.retention.time=90d
   --storage.tsdb.retention.size=4GB
In this example, retention is limited to 90 days and storage usage is capped at 4 GB.
Put the result in Grafana
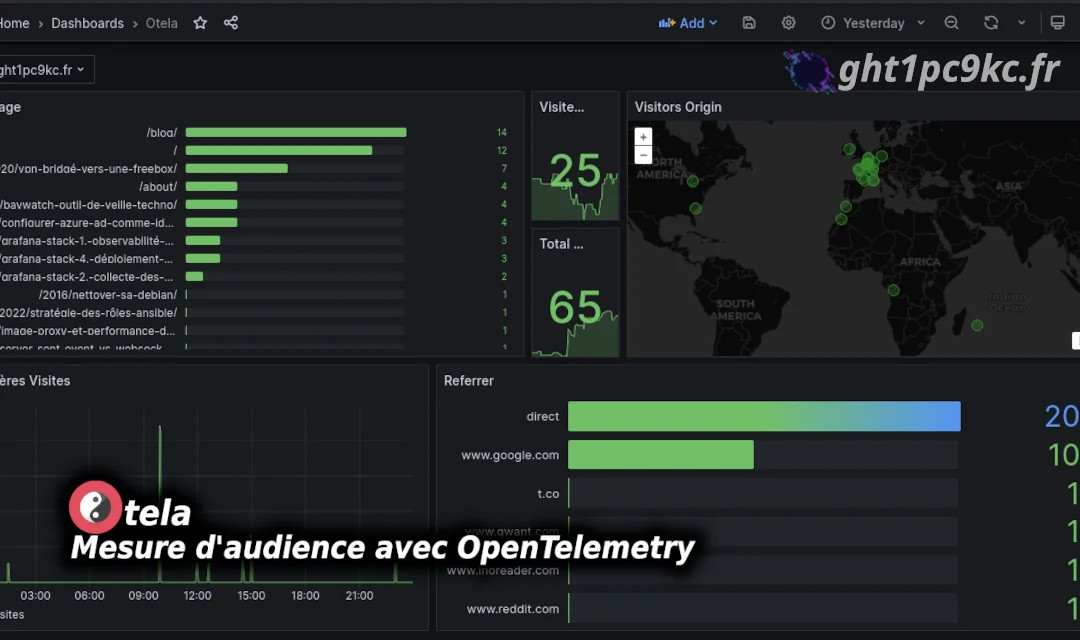
Finally, after a bit of setup in Grafana, we get a dashboard that looks like this:
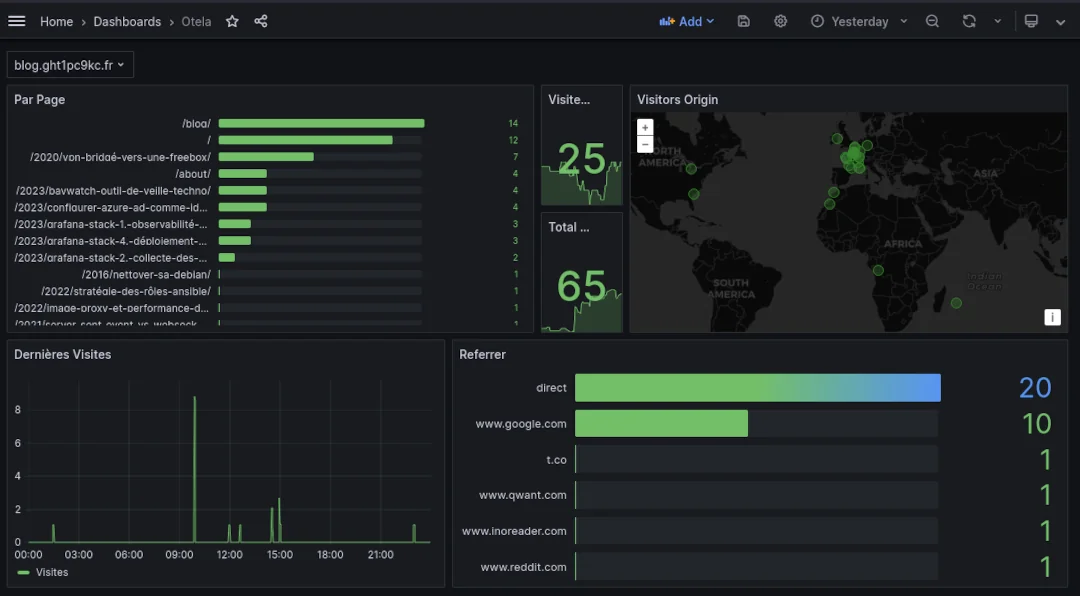
Yep, it’s pretty clear this blog is only visited by a handful of curious tech folks 😄 — though, to be fair, this was a weekend snapshot. Traffic usually picks up during the week.
You can find the dashboard JSON in this gist .
Thanks to the span counter and the custom attributes we configured, the dashboard shows :
- Total number of visits
- Number of unique visitors
- Referrers
- Which pages were visited and how often
- And, thanks to geolocation, dots on a map 🗺️
Conclusion
All configuration files are available in this gist .
In the end, this setup fits my needs perfectly and is a great replacement for Matomo. Plus, thanks to Otela, the data is entirely stored and controlled in France. Nothing leaves my servers.
That said, the solution isn’t flawless. Prometheus isn’t really meant to store this type of data. Something like Loki for logs would be more appropriate. For now, Otela is just a proof of concept — I haven’t yet figured out the best way to route the data into Loki.
In the meantime, feel free to send me your feedback on the solution!